Shares to watch

Wattie

Member
Messages
8,640
That's interesting - tomorrow could be "margin call Monday" in other geographies perhaps, which will accelerate selling as people desperately try to get out of their positions.

MaseratiGent what's your take on this? ...
Notice about stock market in #China. No one is allowed to sell when the market resume on Feb. 3. Biding price to be controlled before opening, no net sell before Feb. 7. Needs special permission for sales over 10M yuan. #CCP fearing market crash #Coronavirus #CoronavirusOutbreak pic.twitter.com/lnGIdQJCe2
— 曾錚 Jennifer Zeng (@jenniferatntd) February 2, 2020
Out of concern over widespread stock selling amid the #coronavirus outbreak, China's #stock regulator will ban short sales of securities starting from Monday: reports pic.twitter.com/ehSZuEjE5I
— The Business Source (@GlobalTimesBiz) February 2, 2020
And 21st Century Herald confirms that China's securities regulator CSRC has reportedly notified brokerages to suspend short selling of stocks from Feb 3...

#China's securities regulator CSRC has reportedly notified brokerages to suspend short selling of stocks from Feb 3, according to the 21st Century Business Herald.
— YUAN TALKS (@YuanTalks) February 2, 2020
 

Wattie

Member
Messages
8,640
OTM puts are definitely worth a go - have Feb (3000) and May (2000) SPX put butterflies in place, together with a Feb TSLA 585 (gap fill) butterfly. You never know ... !
Can you explain this for the “thicko’s” around here. Ie me.
On second thoughts don’t bother as it won’t alter my “thickness”.
 

Froddy

Member
Messages
1,072
Can you explain this for the “thicko’s” around here. Ie me.
On second thoughts don’t bother as it won’t alter my “thickness”.
Hi Wattie,

What it means is that I've bought options (stock derivatives) in the S&P (SPX) and Tesla (TSLA). These are "puts" as I'm wagering that both instruments will decline. The opposite of a "put" is a "call".

Options have expiry dates and I've wagered that the S&P will get close to 3000 points by February's monthly expiration (the third Friday of the month), and will get close to 2000 points by the May expiration; as regards TSLA, this gapped up following its recent earnings report, and I have wagered that it will retreat to its pre-earnings value by February's monthly expiration. The S&P 3000 trade was originally placed as a cheap "hedge" to protect my long positions; the S&P 2000 trade was placed as (an even cheaper) lottery ticket trade in case of a crash (which we may now be facing) with a reward:risk ratio of 115:1 if it comes off. The TSLA trade was placed last week as, historically, the stock likes to fill price gaps. The R:R on that trade is 32:1.

The trades I've placed are "out the money" (OTM) as they have no intrinsic value as the stock has not yet fallen to the level I've wagered. Their value is presently only measured by time (extrinsic value), and this decays as we get nearer expiration. Because of this, they are cheaper than "in the money" (ITM) options which have an intrinsic value at the point of purchase. In the event that the SPX and TSLA options move "into the money", the options will pick up value very quickly.

So what MaseratiGent was saying is that, in circumstances in which the markets could move sharply downwards, it may be worth risking the (normally) improbable by purchasing cheap OTM puts as, if they come off, the returns can be healthy. He then went on to say that a lot had been "priced in"; this is because in times of low volatility, put options are cheap, but they become more expensive as volatility increases. So the risk:reward which I got when I bought my OTM SPX puts in December would not be the same if I bought those options today.

As regards "butterflies" this refers to the type of spread trades which I have placed, best explained here:

https://www.investopedia.com/articles/optioninvestor/09/profit-out-of-the-money-butterfly.asp

Hope this helps!
 
Last edited:

Wattie

Member
Messages
8,640
Hi Wattie,

What it means is that I've bought options (stock derivatives) in the S&P (SPX) and Tesla (TSLA). These are "puts" as I'm wagering that both instruments will decline. The opposite of a "put" is a "call".

Options have expiry dates and I've wagered that the S&P will get close to 3000 points by February's monthly expiration (the third Friday of the month), and will get close to 2000 points by the May expiration; as regards TSLA, this gapped up following its recent earnings report, and I have wagered that it will retreat to its pre-earnings value by February's monthly expiration. The S&P 3000 trade was originally placed as a cheap "hedge" to protect my long positions; the S&P 2000 trade was placed as (an even cheaper) lottery ticket trade in case of a crash (which we may now be facing) with a reward:risk ratio of 115:1 if it comes off. The TSLA trade was placed last week as, historically, the stock likes to fill price gaps. The R:R on that trade is 32:1.

The trades I've placed are "out the money" (OTM) as they have no intrinsic value as the stock has not yet fallen to the level I've wagered. Their value is presently only measured by time (extrinsic value), and this decays as we get nearer expiration. Because of this, they are cheaper than "in the money" (ITM) options which have an intrinsic value at the point of purchase. In the event that the SPX and TSLA options move "into the money", the options will pick up value very quickly.

So what MaseratiGent was saying is that, in circumstances in which the markets could move sharply downwards, it may be worth risking the (normally) improbable by purchasing cheap OTM puts as, if they come off, the returns can be healthy. He then went on to say that a lot had been "priced in"; this is because in times of low volatility, put options are cheap, but they become more expensive as volatility increases. So the risk:reward which I got when I bought my OTM SPX puts in December would not be the same if I bought those options today.

As regards "butterflies" this refers to the type of spread trades which I have placed, best explained here:

https://www.investopedia.com/articles/optioninvestor/09/profit-out-of-the-money-butterfly.asp

Hope this helps!
Thank you for the time you’ve taken to explain- sounds pretty complicated but I understand the “covering risk”aspect your introducing.
It’ll be interesting to see what transpires.
Good luck with the positions.
 

Wattie

Member
Messages
8,640
investors beware, yesterday’s stock market rise looks like a “dead bat bounce” to me.....or Fed intervention


Last edited:

Wattie

Member
Messages
8,640
This tragedy presents an opportunity and I may have a case of wine to fund in 6months.
I have therefore invested in
ABBV and now
Gilead


Next 3M as masks sell out.gotta be worth a punt.
 
Last edited:

MaseratiGent

Member
Messages
162
I spent the week buying OTM puts on the DAX and FTSE mostly April and some March & June. With the lockdown Coronavirus growth (believing official figures) is 20% per day.

The market overcame initial panic and rallied, then it's dawning the impact on supply chains and Western firms' P&L, the final penny to drop will be the reality that this can't be contained; the lockdown is unsustainable.

I suspect the market gets nasty 2-3 weeks forward of here. Time for some helicopter money!
 

Wattie

Member
Messages
8,640
I spent the week buying OTM puts on the DAX and FTSE mostly April and some March & June. With the lockdown Coronavirus growth (believing official figures) is 20% per day.

The market overcame initial panic and rallied, then it's dawning the impact on supply chains and Western firms' P&L, the final penny to drop will be the reality that this can't be contained; the lockdown is unsustainable.

I suspect the market gets nasty 2-3 weeks forward of here. Time for some helicopter money!
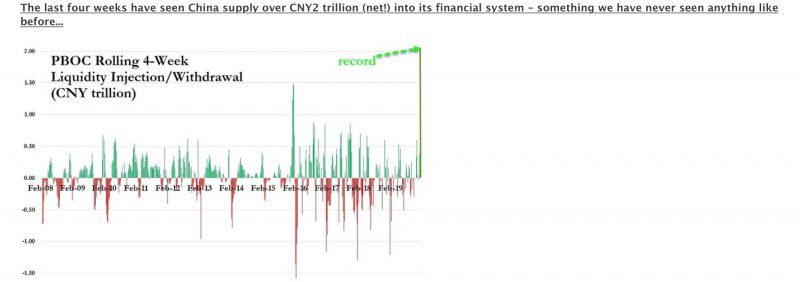
Two trillion already injected by China,
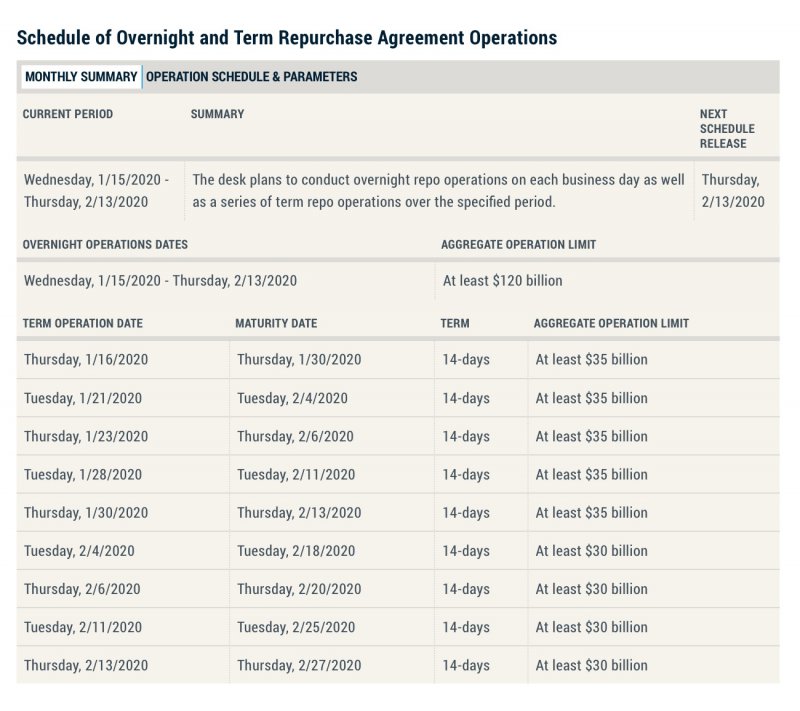
Fedo repo on max.

I thought this was pertinent, whilst somewhat tragic

“Earlier this morning, the Fed had the temerity to lament that "asset valuations are elevated" even as it hinted that as a result of the coronavirus pandemic, which presents a "new risk to the outlook", it may ease further as if printing money can somehow vaccinate people against a deadly virus. Meanwhile, in response to the repo market crisis last September, which should have been long contained by now, and yet which just saw the two most oversubscribed term repo operations in months this week as dealers literally scrambled for liquidity just as the Fed trimmed the operation by a tiny $5 billion to $30 billion ..”

Bad news is good news for markets as they create money from thin air to maintain the illusion all is just fine.

65370
 
Last edited:

Froddy

Member
Messages
1,072
Gold related, take a look at Greatland Gold if you fancy a higher risk punt. Their share price has doubled this year on news of a possible (increasingly probable) tier 1 gold find in western Australia. Been following them for a while and 2020 could well be their breakout year.

As always, do you own research.

Greatland Gold looks … um … great! Well done AT3200AC - you must be delighted too!!
Comparing last week's chart: https://www.tradingview.com/x/zVOJcMEW/
With this week's chart: https://www.tradingview.com/x/wLQh6qSM/

Shows that the worrying 4 level (selling resistance zone) has been broken and, significantly, the volatility squeeze has fired (circled area now has a green dot under the blue bar). Typically, this will go on for 8 - 10 bars (i.e. 8 - 10 months). Fingers crossed for you!
 

Wattie

Member
Messages
8,640
Thanks,
Many congrats, Wattie - beautiful trades - you must be delighted with how they've performed today!
just playing the global liquidity game.....with a little knowledge.
Both up again today...ABBV by 5% plus.

65363

My bet with C has everything stacked against it. Central banks will print to the moon.....to keep this Ponzi scheme alive. May as well go along for the ride, book profits and then get out of dodge before the shtf and it all comes down.
 

CatmanV2

Member
Messages
48,782
Thanks,

just playing the global liquidity game.....with a little knowledge.
Both up again today...ABBV by 5% plus.

View attachment 65363

My bet with C has everything stacked against it. Central banks will print to the moon.....to keep this Ponzi scheme alive. May as well go along for the ride, book profits and then get out of dodge before the shtf and it all comes down.

My guess is that you'll be paying for my case of wine but you'll still ahead with the profits.

C
 

Wattie

Member
Messages
8,640
Greatland Gold looks … um … great! Well done AT3200AC - you must be delighted too!!
Comparing last week's chart: https://www.tradingview.com/x/zVOJcMEW/
With this week's chart: https://www.tradingview.com/x/wLQh6qSM/

Shows that the worrying 4 level (selling resistance zone) has been broken and, significantly, the volatility squeeze has fired (circled area now has a green dot under the blue bar). Typically, this will go on for 8 - 10 bars (i.e. 8 - 10 months). Fingers crossed for you!
Yup that was an excellent call up almost 10% today. I’d be in that if I held £, but I don’t anymore. I,m loaded up with aud$ and $ gold miners as I expect them to rise even further when central bank induced insanity gives way.
 

Froddy

Member
Messages
1,072
Thanks,

just playing the global liquidity game.....with a little knowledge.
Both up again today...ABBV by 5% plus.

View attachment 65363

My bet with C has everything stacked against it. Central banks will print to the moon.....to keep this Ponzi scheme alive. May as well go along for the ride, book profits and then get out of dodge before the shtf and it all comes down.
Don't write off your bet, Wattie: nobody knows what's going to happen, and there are quite a few technical reasons to support your view.

First, S&P Fibonacci timing which I mentioned last night has been confirmed: https://www.tradingview.com/x/KrrmULe4/

As has aussie/yen continuation: https://www.tradingview.com/x/vOExGgpb/

Secondly, and which I've not previously posted:

- S&P has hit (and so far has been rejected by) the 1.618 Fibonacci extension of the December 18 low to April 19 high on the weekly chart: https://www.tradingview.com/x/gexSsWYs/

- S&P is 2 points off the 2.618 Fibonacci extension of the July 19 high to August 19 low on the weekly chart: https://www.tradingview.com/x/DfIwpibj/

We may see a small bounce next week (to c. 335) and then the second Fibonacci timing extension comes into play: https://www.tradingview.com/x/DqqDhUux/

Who knows?!

MaseratiGent thinks it's looking bleak - my money's on him!
 
Last edited:

Wattie

Member
Messages
8,640
Don't write off your bet, Wattie: nobody knows what's going to happen, and there are quite a few technical reasons to support your view.

First, S&P Fibonacci timing which I mentioned last night has been confirmed: https://www.tradingview.com/x/KrrmULe4/

As has aussie/yen continuation: https://www.tradingview.com/x/vOExGgpb/

Secondly, and which I've not previously posted:

- S&P has hit (and so far has been rejected by) the 1.618 Fibonacci extension of the December 18 low to April 19 high on the weekly chart: https://www.tradingview.com/x/gexSsWYs/

- S&P is 2 points off the 2.618 Fibonacci extension of the July 19 high to August 19 low on the weekly chart: https://www.tradingview.com/x/DfIwpibj/

We may see a small bounce next week (to c. 335) and then the second Fibonacci timing extension comes into play: https://www.tradingview.com/x/DqqDhUux/

Who knows?!

MaseratiGent thinks it's looking bleak - my money's on him!
I really wish I had the understanding and confidence you and MaserG have to play these markets.
I simply don’t so as a result have to keep it simple with long calls in researched positions, capturing profits and a lot of gut feeling!

I’m in the bleak camp with a don’t fight the Fed mentality.

Coronavirus May push Central banks to the end of their credibility if a solution to the global infection spread is not found soon. Given the known disease parameters I can’t see anything other than an enforced lockdown of the public stemming its spread....like China is doing.

6 months is a very long time for this to develop
 

Wattie

Member
Messages
8,640
Virus, market fundamentals, true price discovery.....irrelevant.

Print, print print Out of thin air is all that matters. Billions and Billions......

Expect stocks to rise.

65368
 

AT3200AC

Junior Member
Messages
73
Greatland Gold looks … um … great! Well done AT3200AC - you must be delighted too!!
Comparing last week's chart: https://www.tradingview.com/x/zVOJcMEW/
With this week's chart: https://www.tradingview.com/x/wLQh6qSM/

Shows that the worrying 4 level (selling resistance zone) has been broken and, significantly, the volatility squeeze has fired (circled area now has a green dot under the blue bar). Typically, this will go on for 8 - 10 bars (i.e. 8 - 10 months). Fingers crossed for you!
Thanks Froddy - the SP has felt unstoppable over the last few weeks. Interesting that your 8-10 months chart prediction aligns with Greatland’s farm-in partner Newcrest publishing a Maiden Resource Estimate at Havieron in Western Australia. At the moment they can’t find the end of the discovery after a year of drilling with cautious estimates at 5.5M oz gold identified so far and a bucket load of Copper too.
 
Last edited: